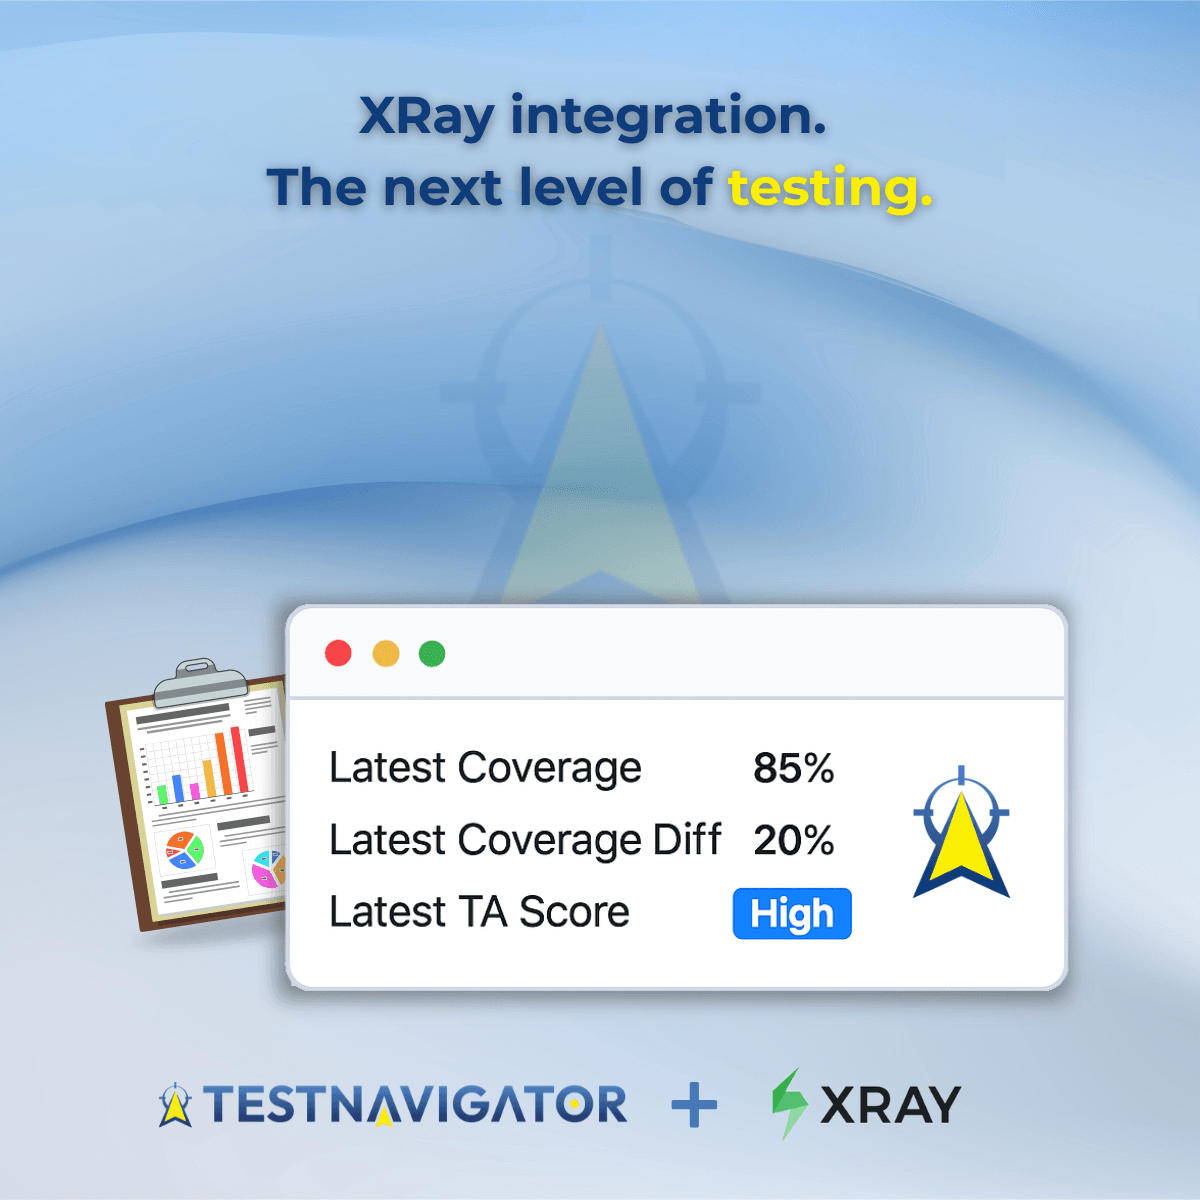
One of the latest developments in TestNavigator is the Xray integration, which creates a direct connection between Jira-based test management and actual code quality data. The goal was to enable development and testing teams to monitor software quality on a single interface more efficiently, based on real data.
What is Xray and Why Connect It with TestNavigator?
Xray is a widely used test management tool that integrates directly into the Jira system and supports both manual and automated testing. It can be integrated with several test frameworks such as JUnit, TestNG, Cucumber, or Robot Framework and provides capabilities for managing test plans, test cases, executions, and reports.
With TestNavigator, these well-known test management functions are now complemented with measurable, code-level quality data. This allows developers and testers not only to see the results of executed tests but also to understand the extent to which the code has been covered by testing.
What Does TestNavigator Add to Xray?
After the integration, TestNavigator automatically collects and updates the following key data in the Xray interface:
- Latest Coverage: total code coverage measured during the last test execution
- Latest Coverage Diff: coverage of the changed code segments
- Latest TA Score: execution order proposed by TestAdvisor, ensuring the highest probability of defect detection
These values appear directly between Xray Test Executions and Test Cases, giving teams a clear view of which parts of the code changed during a development cycle, which parts are covered by tests, and where untested code remains.
How Does the Integration Work in Practice?
When you create a test execution in Xray, the associated test cases automatically appear in TestNavigator — no manual synchronization needed. TestNavigator then monitors code coverage and changes in real time throughout the test execution. Measurement results are continuously updated, providing immediate insight into which parts of the code are covered. When the execution finishes in Xray, TestNavigator automatically stops measuring and sends the results back to the Xray interface. A detailed XLS report follows, showing which modules were involved in the testing, the code coverage, and the test case outcomes.
These same data can also be visually examined in TestNavigator via the Code View interface in Codetree and Heatmap views, making it easy to see which parts of the code were actually tested.
Full Control and Traceability
One of the biggest benefits of the solution is that TestNavigator provides not just static data but real-time, dynamic measurements. For example, if you add a new test case to an already running or closed Test Execution, Xray automatically notifies TestNavigator, which restarts measurement, updates the coverage data, and creates a new report.
The terminology and operation of the two systems are harmonized:
- Xray Test Execution = TestNavigator Test Cycle
- Xray Test Case = TestNavigator Test Case Execution This common ground ensures that teams can work seamlessly, regardless of which interface they use daily.
An Integration That Truly Adds Value
With the Xray integration, TestNavigator provides more than just data — it connects development, testing, and business decisions. From Jira tasks to code measurement, from test coverage to automatic reports, everything works in a single ecosystem. Now teams can precisely see how the code performs under real tests — and this is the knowledge that determines software quality in the long term.